 Potato shipper/packers develop premium and semi-premium potato products that were previously cost prohibitive
By Paul Mitchell, University of Wisconsin-Madison Department of Agricultural and Applied Economics, and Nurlan Utesov, Ph.D. graduate student
The Wisconsin fresh potato industry has enjoyed several years of a higher grower return index and higher wholesale prices than Idaho, the Columbia Basin and Colorado’s San Luis Valley, the other major production regions for fall potatoes.
Figure 1 plots the wholesale price advantage for Wisconsin potatoes relative to these other regions, from 2006 to 2018, based on the U.S. Department of Agriculture (USDA) AMS (Agricultural Marketing Service) shipping point prices.
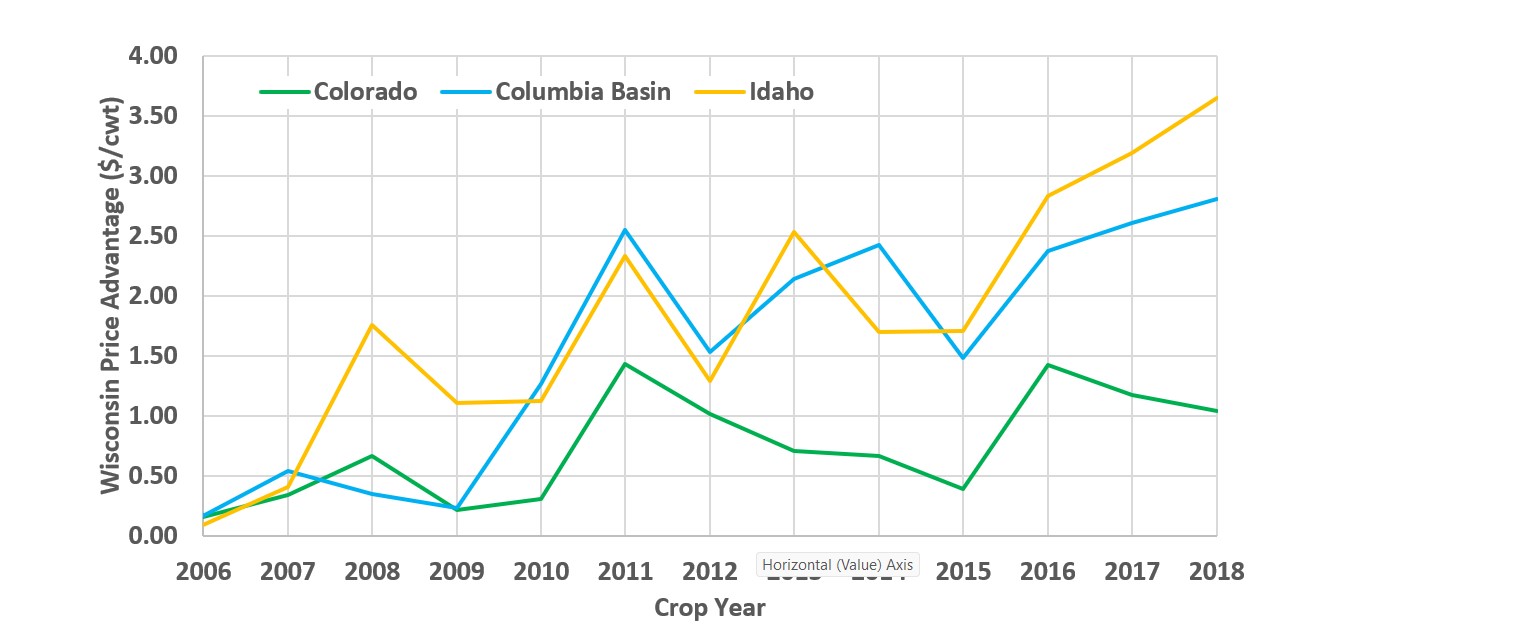 Figure 1. Average wholesale price advantage is illustrated for fresh Wisconsin russet potatoes relative to San Luis Valley Colorado, the Columbia Basin, and Idaho.
In 2006, wholesale prices in the regions were essentially equal, but then the Wisconsin price advantage began to grow, and by 2018, it reached around $1/cwt. (hundredweight) relative to Colorado, $2.75/cwt. relative to the Columbia Basin and $3.50/cwt. relative to Idaho.
Understanding the sources of Wisconsin’s comparative advantage has been a focus of research in the University of Wisconsin-Madison Department of Agricultural and Applied Economics, and this article summarizes current work in progress.
Various hypotheses have been proposed for the sources of this advantage (e.g., lower shipping costs due to the state’s location and the Wisconsin Healthy Grown program).
Based on our current research, we attribute some of this price advantage to early adoption of optical sorting technology in Wisconsin packing sheds combined with improved coordination among potato growers and shipper/packers in the state based on higher average wholesale prices from market segregation facilitated by this sorting technology.
Optical sorting technologies have become more widely adopted in the U.S. produce industry over the last 20 years, including some potato packing sheds in Wisconsin.
The technology has reduced the per unit cost of sorting and grading potatoes, thus allowing potato shipper/packers to develop premium and semi-premium potato products that previously were cost prohibitive to produce at scale.
By segregating markets and developing quality fresh potato products that could command higher retail and wholesale prices, packing sheds were able to financially reward growers for producing potatoes better matched to consumer preferences.
Our long-term goal is to estimate the social benefits generated by segregating this market using optical sorting technology and the distribution of these benefits among growers, shipper/packers, retailers, and consumers.
RETAIL SCANNER DATA
Our primary data source is Nielsen’s Retail Scanner Data for fresh potatoes, from 2010 to 2019, sold at select retail grocery stores. Specifically, the data set consists of weekly prices and volumes for fresh potato products by UPC code generated by point-of-sale systems from more than 90 retail chains across all U.S. markets.
We categorize potatoes into the three quality levels based on the retail price: 1) Typical potatoes with a price less than or equal to $0.60/lb.; 2) Semi-premium potatoes with a price exceeding $0.60/lb. but less than $1.50/lb.; and 3) Premium potatoes with a price exceeding $1.50/lb.
The preliminary analysis summarized here focuses only on Wisconsin and includes stores in four marketing areas defined by Nielsen based on television coverage: Milwaukee, Madison, Green Bay-Appleton, and La Crosse-Eau Claire.
Nielsen data does not include scanner data from all retailers. Missing retailers include Kroger, Aldi, Trader Joe’s, and Costco, while Walmart was not added until 2018. As a result, only one Wisconsin brand is identifiable in the Wisconsin stores included in this analysis.
When we expand the geographic coverage of our analysis, we anticipate having data for other Wisconsin brands.
The final analysis summarized here uses data from five major grocery chains in these four regions of Wisconsin, with the number of stores ranging from a low of 208 in 2010 to a peak of 240 in 2018.
These five chains together accounted for roughly 90% of the potato sales volume in the Nielsen data for Wisconsin over these years.
FRESH POTATO RETAIL TRENDS
Figure 2 summarizes retail trends for fresh potatoes sold in the four Wisconsin regions in the five major chains available in the Nielsen data, for 2010 to 2019.
The volume for generic store brands slowly declined over the study period, falling from 11 million pounds in 2010 to less than 5 million in 2019.